IELTS Task 1 · Mô tả biểu đồ / quy trình
Task 1 · Bar chart: internet access
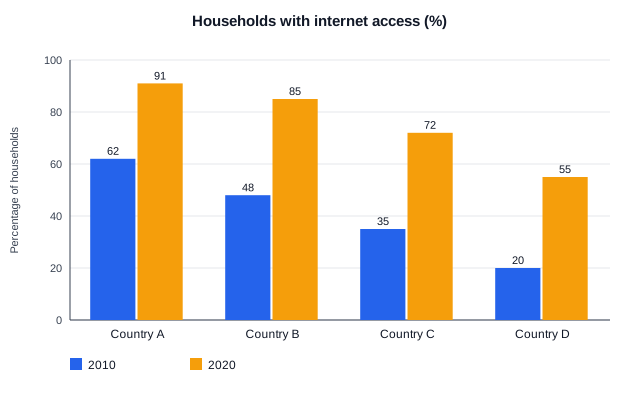
The bar chart below shows the percentage of households with internet access in four countries in 2010 and 2020.
Summarise the information by selecting and reporting the main features, and make comparisons where relevant.
Write at least 150 words.
Thời gian gợi ý 20 phút · tối thiểu 150 từ.