IELTS Task 1 · Mô tả biểu đồ / quy trình
Task 1 · Pie charts: sources of energy
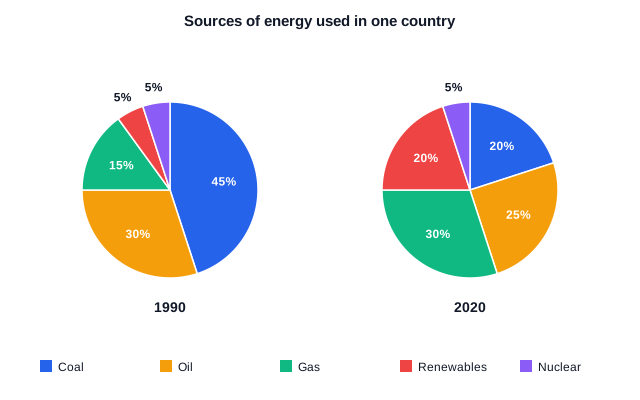
The two pie charts below show the sources of energy used in one country in 1990 and in 2020.
Summarise the information by selecting and reporting the main features, and make comparisons where relevant.
Write at least 150 words.
Thời gian gợi ý 20 phút · tối thiểu 150 từ.